Benchmarking
Benchmarking with European tech hubs
In order to place Rotterdam in the context of Europe’s tech landscape, KPIs pertaining to each of the former chapters – education, companies & employment, and investment – are compared to six leading European tech cities. London, Paris and Berlin, as Europe’s giants, serve as the highest standard against which to compare Rotterdam. Further, Amsterdam, Dublin and Copenhagen serve as more level benchmarks, given their smaller number of inhabitants, whose reputation as tech hubs stem less from their absolute numbers and more from the density of their ecosystems. A few comparisons are highlighted below.
Tech talent & education
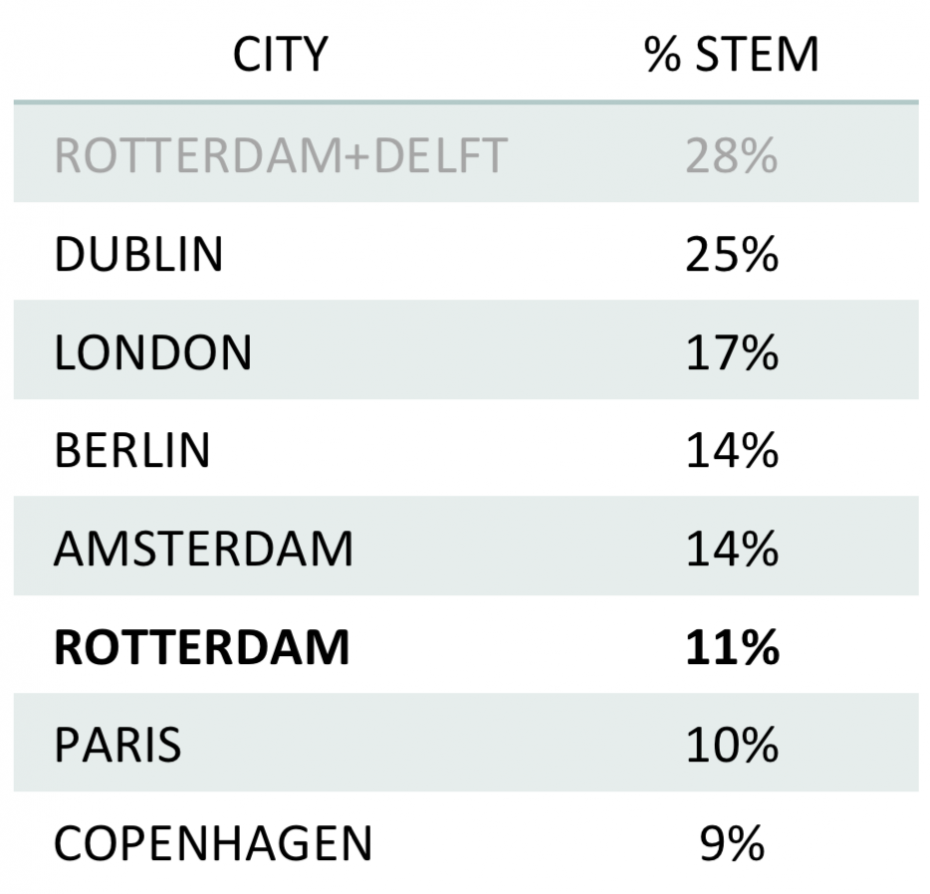
A closer look at the higher education sphere of each city portrays Rotterdam in a positive light. With more than 88,000 enrolled students, Rotterdam has the second highest number of students per capita, surpassed only by Paris.When it comes to the percentage of STEM students, Rotterdam’s 11% is average. However, when Delft is treated as part of the ecosystem, the region ranks first among the seven cities.
Tech companies & employment
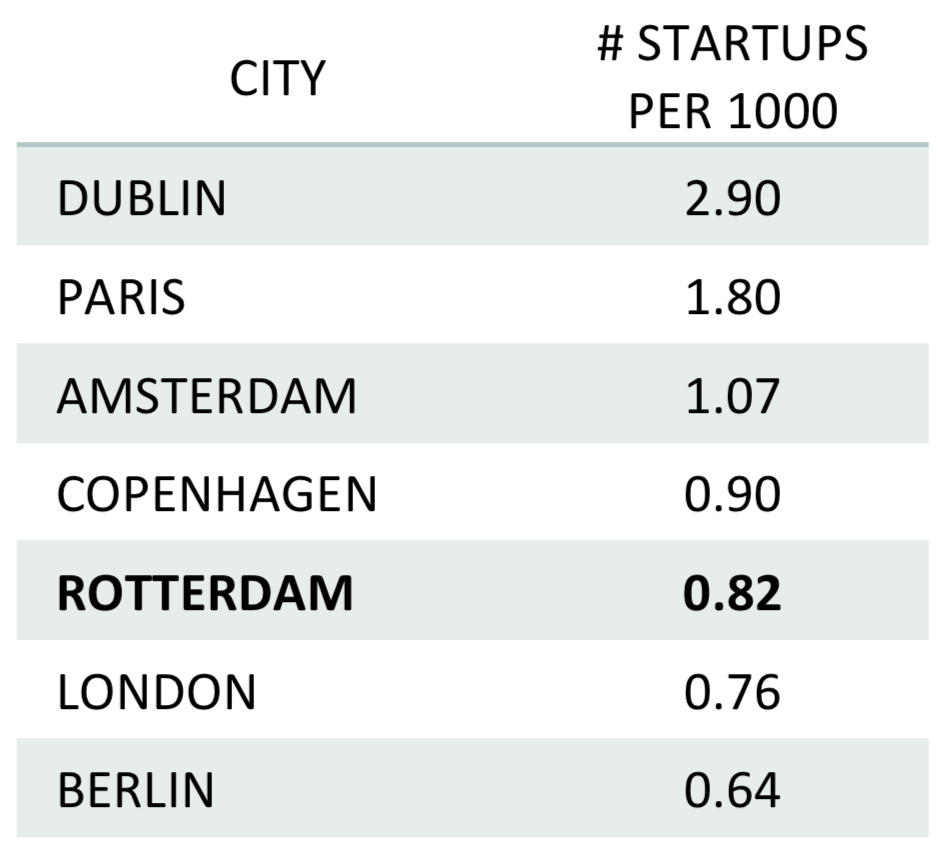
Interestingly, London and Berlin have a relatively low startup density. Rotterdam, Copenhagen and Amsterdam are expectedly similar. Dublin, in turn, is leaps ahead of the other cities when it comes to startups per capita. ICT vacancies per capita confirm that Rotterdam’s tech talent deficit is severe. Unfilled vacancies (especially if growing) point to the bottleneck keeping companies from growing as fast as they would like to.
Tech investment
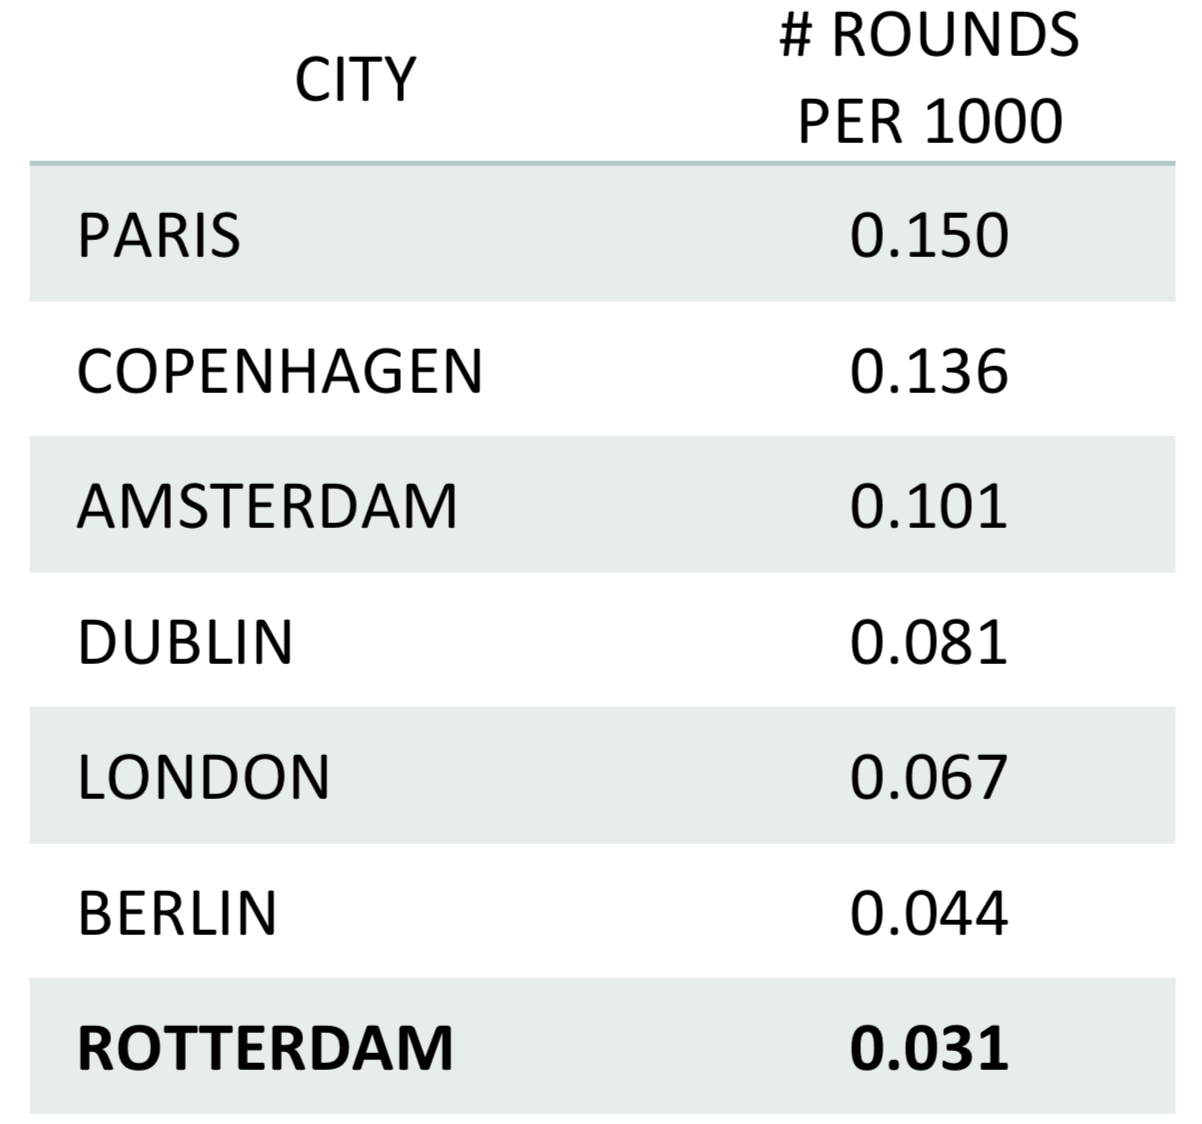
Rotterdam has both the lowest total capital invested per capita and the least amount of investment rounds. Given the discrepancy of funding year to year, often influenced by a few large investments (or the lack thereof), this ranking depends highly on the year analysed. Nonetheless, funding is clearly a comparative wekness of Rotterdam, dependent in part on the exposure and attention of the ecosystem as a whole.
Benchmark overview
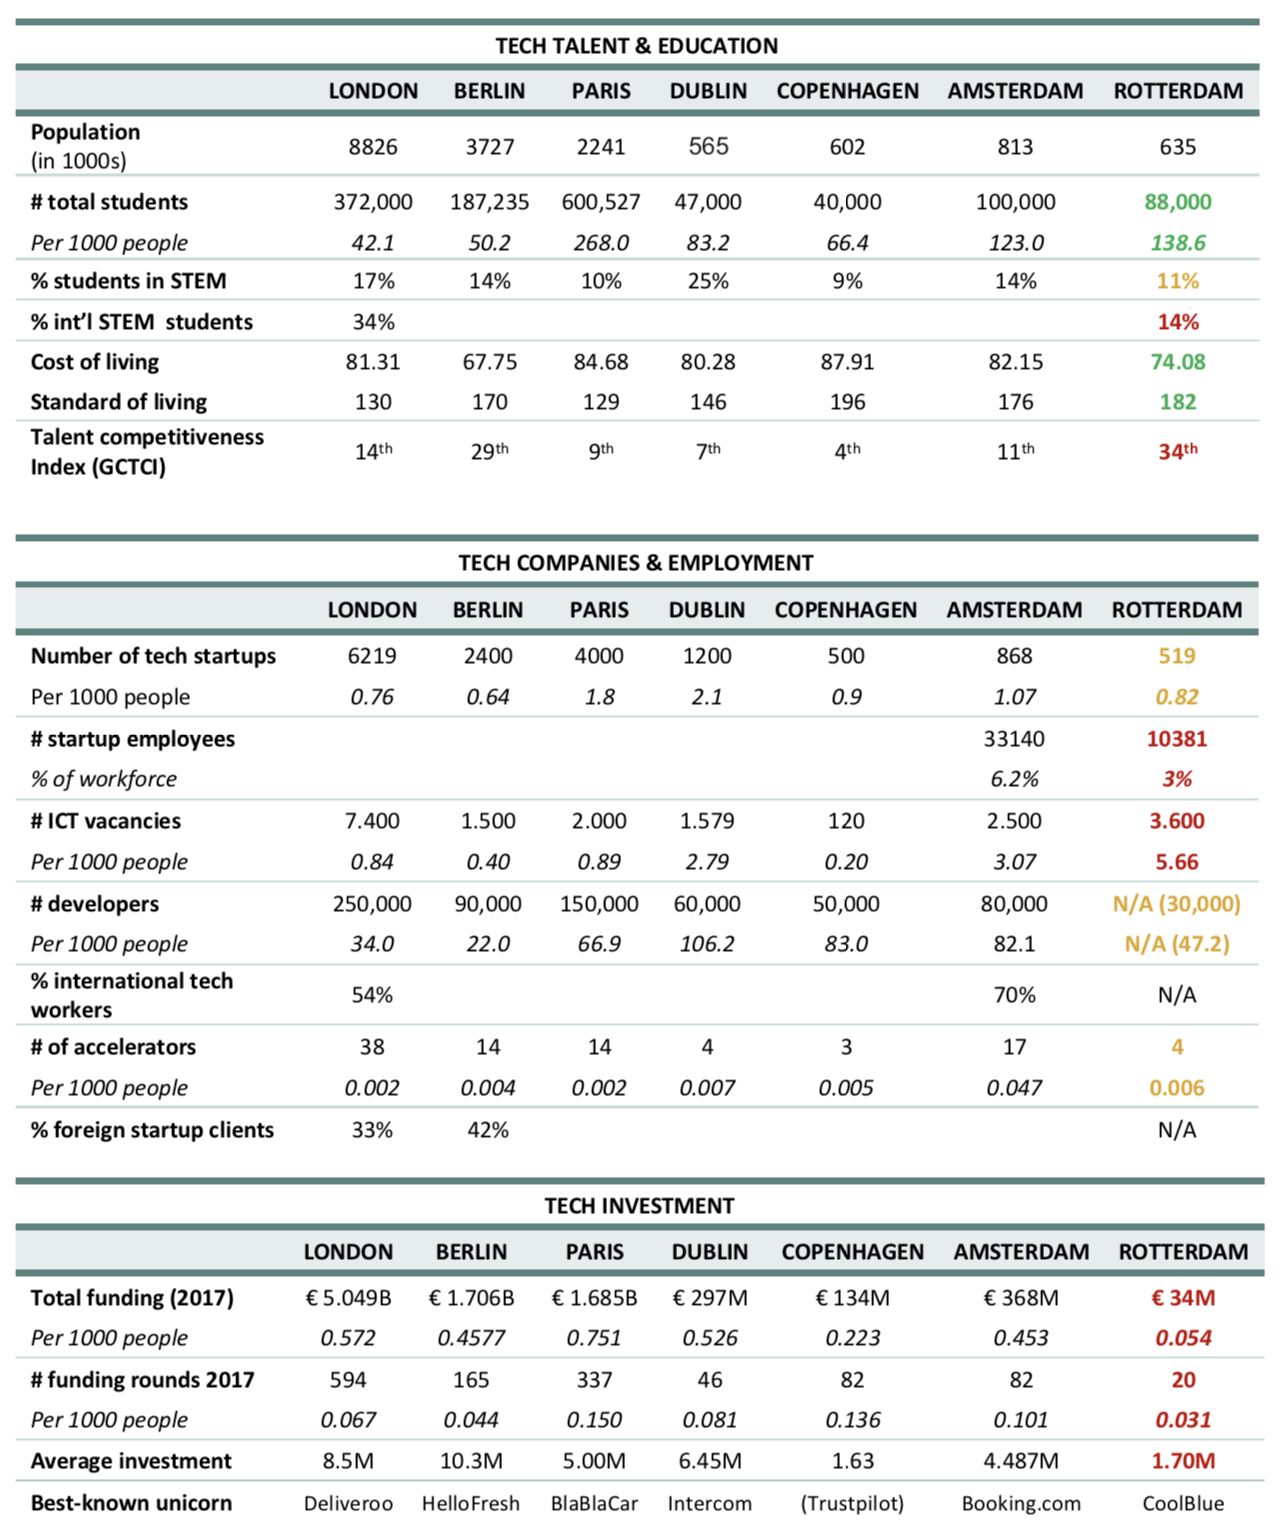
Beyond the KPIs discussed above, the table below presents a number of metrics related to education, entrepreneurship and investment across the seven cities selected. For each KPI, Rotterdam is indicated to score relatively well (green), average (yellow) or poorly (red) in comparison to the other benchmark cities. It should be noted that all selected cities are commonly considered to be best-practice examples of a progressive, well-balanced tech ecosystem.
Share this article:
[social_warfare buttons]
Download the full PDF report below:
Includes the following chapters in full length:
– Tech Education
– Tech Companies
– Tech Employment
– Tech Investment
– Benchmarking
– Stakeholder Interviews
– Recommendations & Conclusion